Metrics Versus Statistics: What’s the Difference?
(Updated March, 2024)
Recently, Brian talked about succeeding by managing with statistics. One of the most common questions we get is “what’s the difference between them?”
As private practice owners, our main duties are to lead, educate, and motivate. Without metrics and statistics in our practice, this becomes difficult. All business owners seek to motivate staff to a certain level of accountability and responsibility so that they come to work feeling like they’re sharing in the vision of the practice. We want them to care about the business as a whole versus simply “What’s in it for me?” As you hire and train more staff who are passionate about hitting their targets and metrics, you will find that your team as a whole will win.
What is a Business Statistic?
Business statistics are an essential part of management. They can be used for quality assurance, financial, production, and operations analysis to measure the performance of an individual or department based on their ability to produce their products or services. There are key statistics that every business owner should know and hold their team accountable to.
What is a Business Metric?
Business metrics are an overall quantifiable measurement that is taken and then used to monitor the success or failure of various business processes. The metrics are the benchmarks (see below) for the business to thrive, we offer MEG Academy clients access to ALL the metrics you should know about your practice.
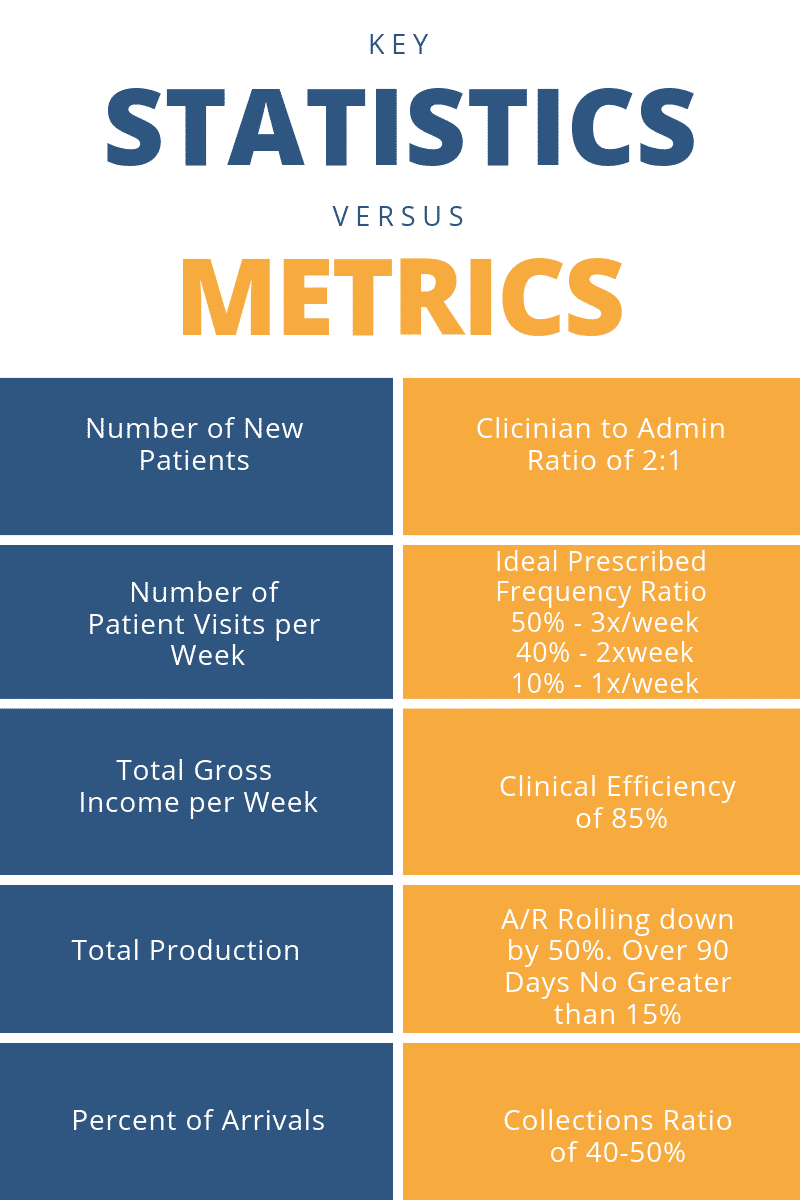
Key Statistics versus Key Metrics
Here are some of the key statistics that the top 10% of physical therapy practices around the US know and understand when managing the practice on a weekly basis. The metrics below are just a few of the ones used by the same 10% in order to manage and measure their operational systems’ effectiveness.
How to Apply Statistics and Metrics in Your Practice
You want to derive statistics in a way that is not taxing on your staff or too much additional labor. How to do this is two-fold: first, 35-45% of your statistics should be pulled from your EMR system. The rest of the stat should be pulled manually with all statistics entered into a shared Google or Excel Spreadsheet for efficient tracking in both numerical and graphical form. Secondly, how do you use them to bring a positive result in the products that they measure? Your managers should have a weekly meeting to review the three-week statistical trend in graphical form with their team who are responsible for producing the related products.
As the CEO, your practice will run in accordance to YOUR policies and the level of training you employ with your staff. You are responsible for measuring and training your team on the metrics and statistics that matter most. Having a comprehensive onboarding and orientation program to onboard new team members, as well as having professional enhancement training will keep your staff invested in the products and quality that keep the business moving forward.